Demography Doesn’t Care — Global Issues

The median ages of populations are expected to continue rising over the coming decades. East Nanjing Road, Shanghai, China. Credit: Shutterstock.
  • Opinion by Joseph Chamie (portland, usa)
  • Inter Press Service

Demography is basically about the mathematics of human populations, i.e., births, deaths, migrations, ageing, morbidity, sex ratios, mobility, size, change, growth, distribution, density, structure, composition, life expectancies, biological, social and economic characteristics, etc.

Demography is relatively straightforward, visible and equitable. For example, in every human population a person is born an infant at age zero, ages one year every twelve months, and eventually over time faces death, too often earlier rather than later unfortunately.

Between birth and death, a wide variety of demographic phenomena or transitions typically occur in human populations. Among them are surviving infancy and childhood, passing through puberty, finding a mate, having offspring, migrating to another place, falling ill or becoming disabled, and experiencing ageing.

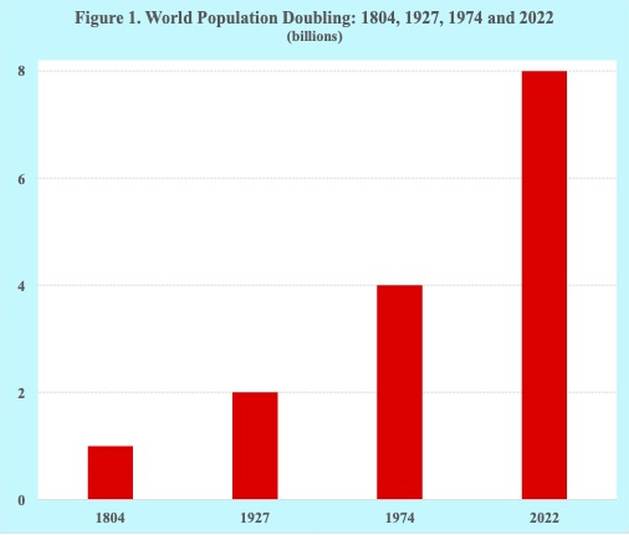
Over the many centuries of human history, the interactions of those various demographic phenomena and transitions have resulted in today’s world population of 8,000,000,000. That extraordinary number of human beings now inhabiting planet Earth is due in large part to the record-breaking rapid growth of world population during the 20th century.

World population reached the one billion milestone at the start of the 19th century in 1804. The 20th century then ushered in what turned out to be the century of rapid demographic growth. World population nearly quadrupled from 1.6 billion at the start of the 20th century to 6.1 billion by the century’s close (Figure 1).

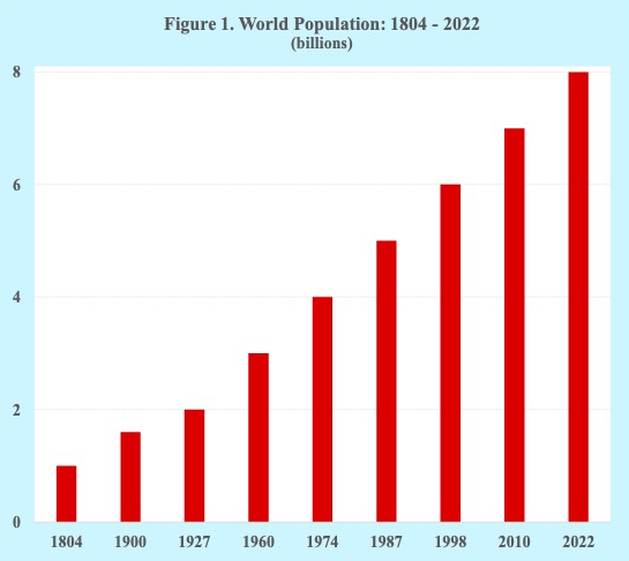
In addition to that unprecedented rapid demographic growth, the world’s annual rate of population growth peaked at 2.3 percent in 1963. Also, by 1990 the world’s annual population increase reached a record high of 93 million.

The unprecedented growth of world population that took place during the 20th century was simply the result of births greatly outnumbering deaths with mortality rates dropping rapidly, especially during the second half of the past century.

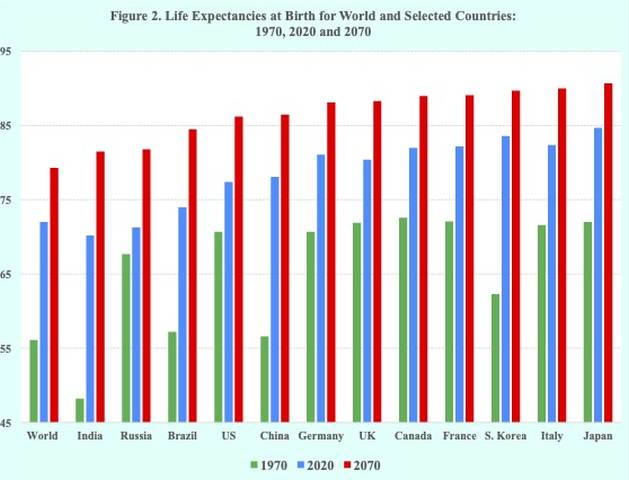
The world’s fertility rate in the 1960s, for example, was about five births per woman and births outnumbered deaths by nearly three to one in the 1980s. Life expectancy at birth increased dramatically, increasing from about 45 years in the middle of the 20th century to about 65 years by the end of the century.

The current demographic situation for the world is different from the exceptional rates, levels and changes of the past century. For example, the growth rate of world population in 2021 was about 0.8 percent, or nearly one-third the peak level in 1963.

In addition, the annual increase of world population in 2021 was about 68 million, or about three-fourths the level in 1990. Also, the median age of the world’s population, which was about 20 years in 1970, has increased by 50 percent, reaching 30 years in 2022.

The world’s fertility rate is now about 2.3 births per woman, or about half the level 60 years ago. In addition, approximately 100 countries have a total fertility rate below the replacement level of 2.1 births per woman.

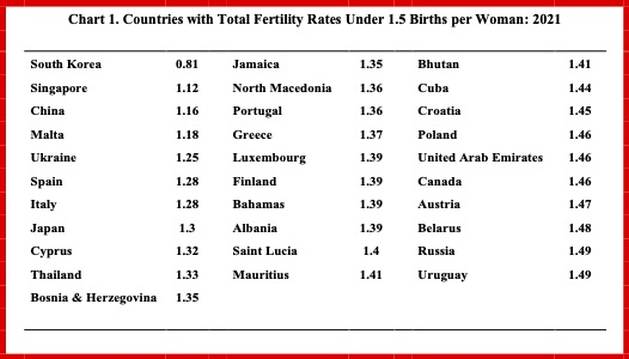
Furthermore, the fertility rates of some thirty countries in 2021 were less than 1.5 births per woman. Several of those countries had fertility rates that were approximately half or less than the replacement level, including China at 1.16, Singapore at 1.12 and South Korea at 0.81 (Chart 1).

As a result of below replacement fertility rates, the current populations of some 60 countries are expected to be smaller by 2070. The total population decline of those countries over the next 50 years is projected to be more than a half a billion. Among the countries with the largest declines in their populations are China (-340 million), Japan (-35 million), Russia (-22 million), South Korea (-16 million) and Italy (-15 million).

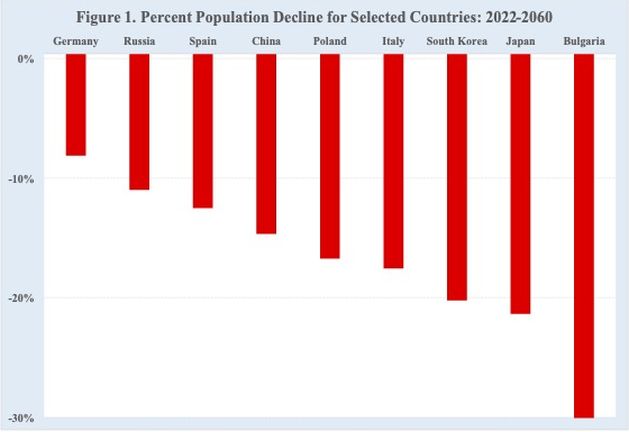
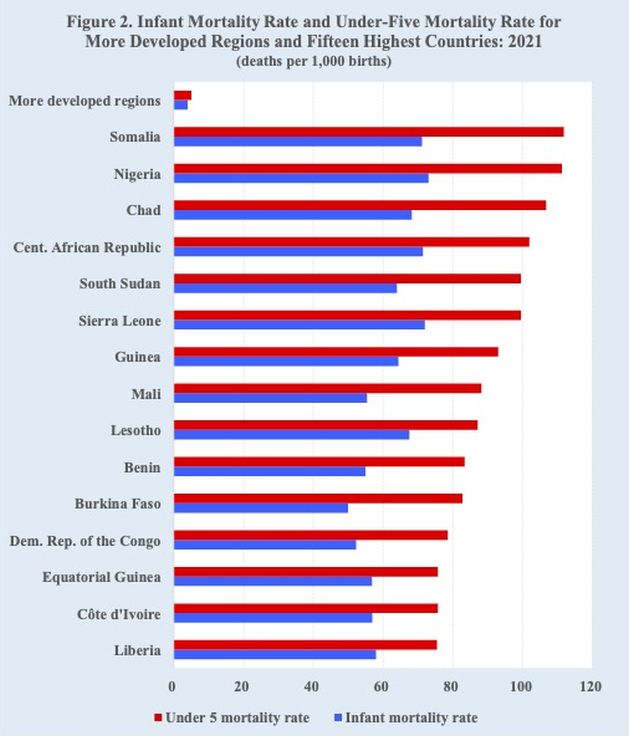
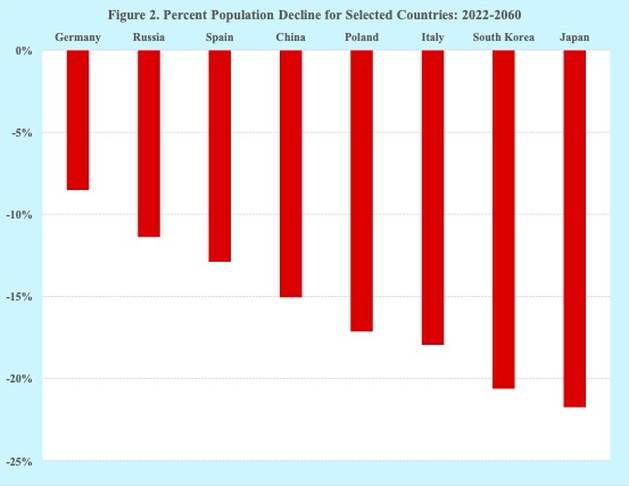
In addition, many countries are expected to experience substantial declines in the relative size of their populations. Many of those countries are projected to have population declines of 10 percent or more over the coming four decades. For example, the relative decline in population size is expected to be 22 percent for Japan, 21 percent for South Korea and 18 percent for Italy (Figure 2).

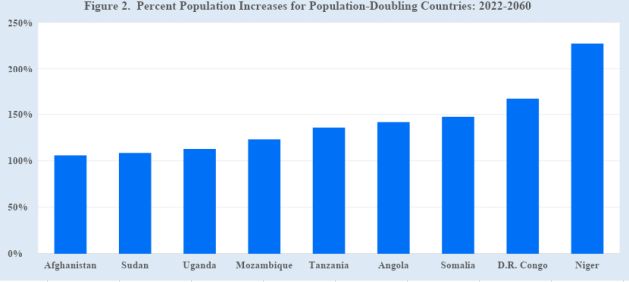
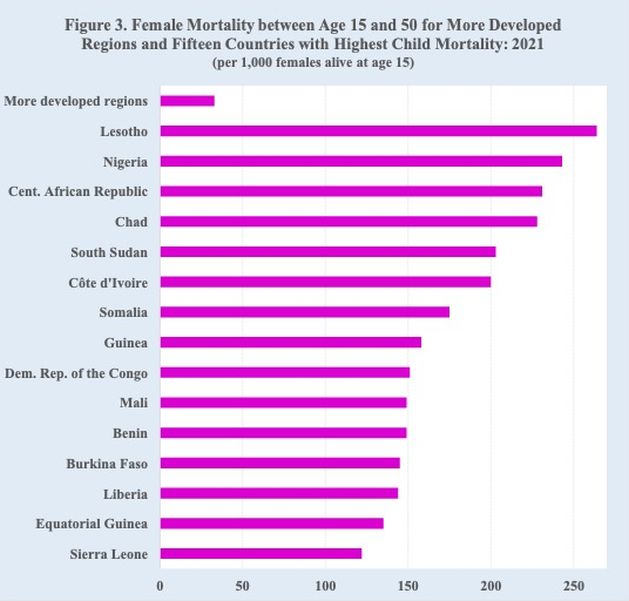
At the other extreme, the populations of two dozen countries, accounting for nearly 10 percent of the world’s population, are expected to more than double by 2060. Those projected population increases by 2060 include 106 percent in Afghanistan, 109 percent in Sudan, 113 percent in Uganda, 136 percent in Tanzania, 142 percent in Angola, 147 percent in Somalia, 167 percent in the Democratic Republic of the Congo, and 227 percent in Niger (Figure 3).

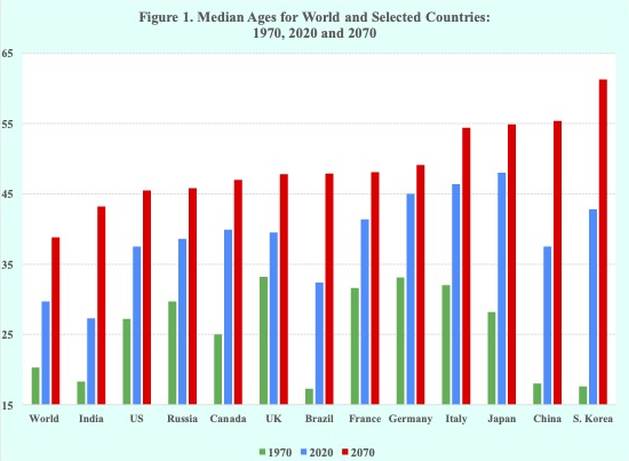
In addition to the projected decline and growth of national populations, the age structures of countries worldwide are expected to become substantially older. Many countries have attained median ages in 2020 above 40 years, such as France at 41 years, South Korea at 43 years, Italy at 46 years and Japan at 48 years.

The median ages of populations are expected to continue rising over the coming decades. The median age for the world, for example, is expected to increase from 30 years today to close to 40 years by 2070. In some countries, including China, Italy, Japan and South Korea, the median ages of their populations by 2070 are projected to be 55 years or older.

Demographic ageing in the 21st century constitutes a major challenge for societies and economies. The consequences of the demographic realities of older population age structures and increasing human longevity are likely unavoidable.

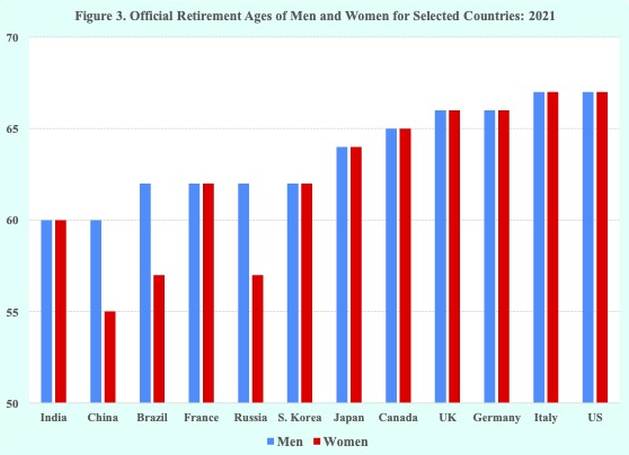
In particular, the ageing of populations is contributing to strains on fiscal revenues and spending on pensions and healthcare for the elderly. Despite the ageing of populations and increases in human longevity, official retirement ages for government pension benefits have remained largely unchanged at comparatively low ages.

In France, for example, the official pension retirement age is 62 years, which is well below the retirement ages of many other developed countries. Despite criticisms, protests and a scheduled national strike from worker unions and leftist opponents, the French government has unveiled a pension overhaul that proposes gradually raise the retirement age to 64 years by 2030.

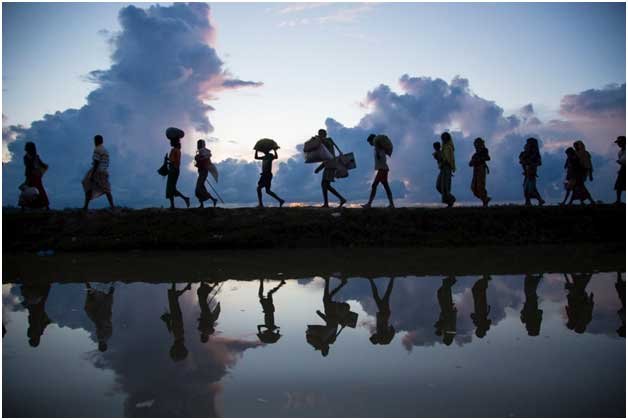
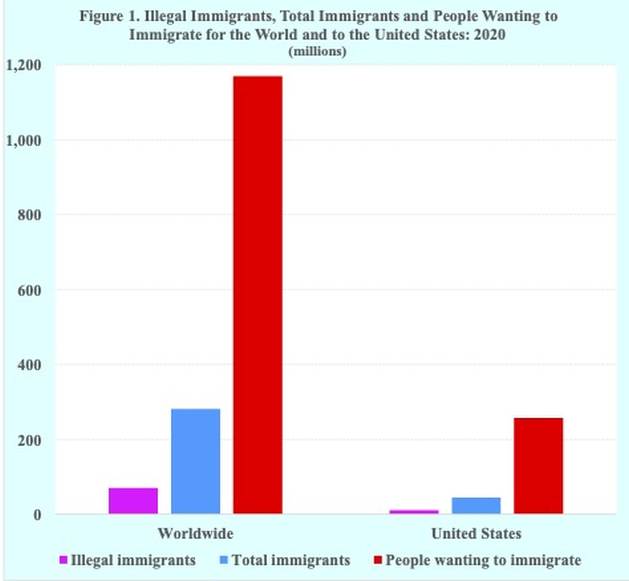
Also, a mounting crisis for a growing number of countries worldwide is illegal immigration. Neither governments nor international agencies have been able to come up with sensible policies and effective programs to address the mounting illegal immigration crisis.

A major factor behind the rise of illegal immigration is the large and growing supply of men, women and children in sending countries who want to migrate to another country and by any means possible, including illegal immigration. The number of people in the world wanting to migrate to another country is estimated at nearly 1.2 billion.

In conclusion, too often many choose to ignore, deny or dismiss today’s demographic realities, such as population growth and decline, demographic aging, declining fertility, rising life expectancy and increasing illegal immigration.

Rather than acknowledging, addressing and adjusting to the challenging consequences of the demographic realities of the 21st century, many are turning to protests, strikes, demonstrations, and balderdash. Demography, however, simply doesn’t care about such things.

Joseph Chamie is a consulting demographer, a former director of the United Nations Population Division and author of numerous publications on population issues, including his recent book, “Births, Deaths, Migrations and Other Important Population Matters.”

© Inter Press Service (2023) — All Rights ReservedOriginal source: Inter Press Service

Check out our Latest News and Follow us at Facebook

Original Source

Raising Retirement Age Coming Soon — Global Issues

Over the past fifty years the world’s life expectancy at birth increased by 16 years, i.e., from 56 in 1970 to 72 in 2020. Credit: Maricel Sequeira/IPS
  • by Joseph Chamie (portland, usa)
  • Inter Press Service

The primary reason for raising the official retirement age is the rapidly rising costs of national old-age pension programs, which are mainly the result of two powerful global demographic trends: population ageing and increased human longevity.

The age structures of populations worldwide are becoming older than ever before. Over the past half century, for example, the median age of the world’s population has increased by 10 years, i.e., from 20 years in 1970 to 30 years in 2020. Many countries have attained median ages in 2020 well above 35 years, such as France at 41 years, South Korea at 43 years, Italy at 46 years and Japan at 48 years (Figure 1).

Moreover, the median ages of populations are expected to continue rising over the coming decades. The median age for the world, for example, is expected to reach close to 40 years by 2070. Also in some countries, including China, Italy, Japan and South Korea, the median ages of their populations by 2070 are projected to be 55 years or older.

The pace of changes in the population age structures of China and South Korea are particularly noteworthy. In 1970 their populations had a median age of 18 years, i.e., half of their populations were children. By 2070 the median ages of China’s and South Korea’s populations are expected to triple to 55 and 61 years, respectively, with the proportion of children declining to 12 and 10 percent, respectively.

Many countries will see their elderly population increase rapidly, reaching about one-third of their total populations by midcentury. In addition, by 2070 the proportion aged 65 years and older in some countries, such as China, Italy, Japan, South Korea and Spain, are expected to be approximately 40 percent.

In addition to markedly older population age structures, life expectancies have increased significantly during the recent past with both men and women living longer than ever before. For example, over the past fifty years the world’s life expectancy at birth increased by 16 years, i.e., from 56 in 1970 to 72 in 2020.

The gains in life expectancies at birth for some countries were even more impressive, with increases of more than 20 years during the past five decades. Again, the gains in life expectancy achieved by China and South Korea are particularly noteworthy. China’s life expectancy at birth increased by 21 years, i.e., from 57 years in 1970 to 78 years in 2020, and South Korea’s increased by 22 years, i.e., from about 62 years in 1970 to 84 years in 2020.

Moreover, the life expectancies of the elderly have also increased over the recent past. At age 65, for example, the world’s average life expectancy increased by four years, from 13 years in 1970 to 17 years in 2020. And in many developed countries, including Canada, Italy, France, Germany, Italy and Japan, life expectancies at age 65 years have reached 20 years or more (Figure 2).

Some of the largest gains in life expectancies at age 65 years have been in East Asia. For example, gains in China, South Korea and Japan were 7, 8 and 9 years, respectively, resulting in life expectancies at age 65 of 18, 22 and 23 years, respectively. In other words, people in those countries on average can expect to live to ages 83, 87 and 88 years, respectively.

Despite the recent setbacks in life expectancies due to deaths from the COVID-19 pandemic, life expectancies of the elderly are expected to continue rising throughout the remainder of the 21st century. For example, by 2070 the world is projected to have an average life expectancy at age 65 of 21 years. Also, many developed countries by that time are expected to have life expectancies at age 65 of 25 years or more, i.e., people surviving on average to age 90.

Even with the ageing of populations and increases in human longevity, official retirement ages in order to receive government pension benefits have remained largely unchanged at relatively low levels, typically below 65 years. For example, the official retirement age in France and South Korea is 62 years and in Brazil and Russia the retirement age is also 62 for men, 57 years for women (Figure 3).

However, some countries are now proposing to raise their retirement ages. China, for example, recognizing its rapidly ageing population, shrinking labor force and its national pension’s expected insolvency by 2035, has said that over the next five years it would gradually delay the legal retirement ages, which have been unchanged for more than 70 years.

Despite public objections in the past, China took an initial step several months ago to raise its current retirement age, which is 60 for men and 55 for white-collar women workers and 50 for blue-collar women workers. In one of its eastern provinces people were permitted to start voluntarily applying for delayed retirement.

Also, the French government, remarking “vivre plus longtemps, travailler plus longtemps”, has proposed that beginning in 2023 the minimum retirement age to receive a full pension be gradually increased from today’s 62 to 65 by 2031. Although previous proposals were shelved due to nationwide strikes, the French government has said that without those proposed changes a decrease in the size of pensions would be needed.

One OECD country, the United States, was among the earliest in legislating an increase in the official retirement age to 67 years to receive full benefits, which is above the current average age for OECD countries. Also, seven OECD countries have introduced linkages between life expectancy and retirement age.

In addition to being unpopular among the general public, raising the official retirement age is an issue that governments are not eager to address. Typically, government officials remain silent on the issue and postpone making decisions regarding projected financial shortfalls in national retirement programs.

In the United States, for example, the Social Security Board of Trustees in its 2022 annual report concluded that if no changes are made, the program will not be able to meet its financial responsibilities by 2035. Although various political statements have been made by government officials, the U.S. Congress has yet to propose the needed legislation to address Social Security’s projected insolvency in a dozen years.

In general, the three major options available to governments to address pension insolvency are: reduce benefits, increase taxes and raise retirement age. Reducing benefits, however, would create financial difficulties for many of the elderly. Increasing taxes is also unlikely to be well received by today’s workers and business communities. Consequently, raising the retirement age may be the least objectionable option to address projected pension insolvencies.

The consequences of the demographic realities of older population age structures and increasing longevity are unavoidable. In particular, those consequences include: decreasing numbers in the labor force per retired person: increasing proportions in old age who are living longer; and rising costs for old age retirement benefits that threaten the solvency of the national programs.

In sum, raising the retirement age addresses many of the consequences of those seismic demographic changes as well as expands the size of the labor force, provides additional years for workers to save for retirement, and deals with the projected insolvencies of government pension programs.

Joseph Chamie is a consulting demographer, a former director of the United Nations Population Division and author of numerous publications on population issues, including his recent book, “Births, Deaths, Migrations and Other Important Population Matters.”

© Inter Press Service (2022) — All Rights ReservedOriginal source: Inter Press Service

Check out our Latest News and Follow us at Facebook

Original Source

A Mounting Global Crisis — Global Issues

Credit: UNOHCR.
  • Opinion by Joseph Chamie (portland, usa)
  • Inter Press Service

Migrant destination countries are facing record high numbers of unlawful border crossings and unauthorized arrivals at their shores, thousands of visa overstayers, and millions of men, women and children residing unlawfully within their countries.

In many of those countries illegal migration is viewed as a threat to national sovereignty. It is seen as undermining cultural integrity. Illegal migration is also creating financial drains on public funds.

Some officials as well as much of the public in those countries have described the continuing illegal immigration to their borders and shores as an “invasion”, a “battle situation” and a “security threat”. And some have called on their governments to “send’em straight back”.

In addition, illegal immigration is also undermining the rule of law, threatening regional cooperation, challenging law enforcement agencies, eroding public support for legal migration, altering political equilibrium and adding to nativism and xenophobia. In addition, the public’s concerns about immigration are reflected in the growing influence of far-right political parties in such countries as Austria, Denmark, Finland, France, Hungary, Italy, Sweden and the United States.

Multinational migrant-smuggling networks are also contributing to the mounting illegal immigration crisis as well as generating substantial profits for criminal organizations. Those networks exploit migrants seeking to leave their countries, offering various services, including transportation, accommodations and critical information.

Government programs and plans to counter migrant smuggling networks have achieved limited success. Also, international attempts to address illegal immigration, such as the Global Compact on International Migration of 2018, have not diminished illegal immigration nor the activities of smuggling networks.

A major factor behind the rise of illegal immigration is the large and growing supply of men, women and children in sending countries who want to migrate to another country and by any means possible, including illegal immigration. The number of people in the world wanting to migrate to another country is estimated at nearly 1.2 billion.

The billion plus people wanting to migrate represents about 15 percent of the world’s population. That number of people wanting to migrate is also more than four times the size of the estimated total number immigrants worldwide in 2020, which was 281 million (Figure 1).

The country with the largest number of immigrants is the United States with almost 48 million foreign-born residents in 2022, or approximately 14 percent of its population. About one quarter of those immigrants, or approximately 11.4 million, are estimated to be illegal immigrants.

While an estimate of the total number of immigrants in the world is readily available, the number of illegal immigrants is a very different matter with few reliable estimates available on a global scale.

Nearly two decades ago it was estimated that perhaps 20 percent of the immigrants were unauthorized migrants. Applying that proportion to the current total number of immigrants of 281 million yields an estimate of about 56 million unauthorized migrants. If the U.S. proportion of illegal immigrants is applied to the total global immigrant population, the resulting estimated number of illegal immigrants in the world is approximately 70 million.

The widely recognized human rights regarding international migration are relatively straightforward. Articles 13 and 14 of the Universal Declaration of Human Rights respectively state, “Everyone has the right to leave any country, including his own, and to return to his country”, and “Everyone has the right to seek and to enjoy in other countries asylum from persecution”.

Importantly, however, everyone does not have the right to enter nor remain in another country. The unlawful entry into a country and overstaying a temporary visit are clearly not recognized human rights. Moreover, to be granted asylum, an individual needs to meet the internationally recognized definition of a refugee.

According to the United Nations 1951 Refugee Convention and the 1967 Protocol, a refugee is a person who is unable or unwilling to return to his or her home country due to past persecution or a well-founded fear of being persecuted in the future “on account of race, religion, nationality, membership in a particular social group, or political opinion.”

Difficult living conditions, such as unemployment, poverty, inadequate housing, lack of health care, marital discord and political unrest, do not qualify an individual for the internationally recognized refugee status nor to a legitimate claim for asylum.

Nevertheless, in the absence of a right to migrate to another country, people wanting to do so are increasingly turning to illegal immigration. And upon arriving at the destination country, many are claiming the right to seek asylum.

Once inside the country, the legal determination of an asylum claim often takes years, permitting claimants time to establish households, find employment and integrate into accepting communities, such as sanctuary cities. Also, many of the unauthorized migrants believe, based on the experiences of millions before them, that government authorities will not repatriate them even if their asylum claim is rejected, which is typically the case.

The mounting illegal immigration crisis is complicated by 103 million people who are estimated to have been forcibly displaced worldwide by mid-2022. That number is a record high for forcibly displaced people and is expected to grow in the coming years.

Approximately 50 percent of those forcibly displaced were displaced internally and 5 percent were people in need of international protection. In addition, the number of refugees has reached a record high of nearly 33 million worldwide and the estimate for asylum seekers is close to 5 million (Figure 2).

The worldwide numbers of forcibly displaced people, internally displaced people and refugees have increased substantially since the start of the 21st century. For example, over the past two decades the numbers of displaced people increased from 38 million to nearly 86 million (Figure 3).

Many of those people have been displaced by weather-related events. UNHCR estimates that an annual average of nearly 22 million people have been forcibly displaced by events related to weather, such as wildfires, floods, and extreme heat temperatures.

Moreover, the numbers of displaced people are expected to increase substantially over the coming decades. Some estimate that by midcentury more than one billion people, largely from less developed countries, could be displaced due to climate and environmental changes and civil unrest.

By third decade of the 21st century, the following major trends contributing to the mounting global illegal migration crisis have become abundantly clear:

  1. Powerful forces worldwide are fueling illegal immigration, including demographics, poverty, smuggling networks, civil unrest and increasingly climate change, which is creating “climate refugees”.
  2. Those potent forces are resulting in large and increasing numbers of men, women and even unaccompanied children arriving at borders and landing on shores of destination countries without authorization.
  3. Unauthorized migrants, as well as visa overstayers, seek to settle in those destination countries by any means available and are not prepared to return to their countries of origin.
  4. Most of the large and growing numbers of unauthorized migrants now residing unlawfully within countries are not likely to be repatriated.

Finally, it is also clear that neither governments nor international agencies have yet been able to come up with effective policies and programs to address the mounting global illegal immigration crisis.

Joseph Chamie is an independent consulting demographer, a former director of the United Nations Population Division and author of numerous publications on population issues, including his recent book, “Births, Deaths, Migrations and Other Important Population Matters.”

© Inter Press Service (2022) — All Rights ReservedOriginal source: Inter Press Service

Check out our Latest News and Follow us at Facebook

Original Source

Balancing Diversity and Meritocracy — Global Issues

Source: U.S. Census Bureau.
  • Opinion by Joseph Chamie (portland, usa)
  • Inter Press Service

In a growing number of areas, including politics, employment, careers, education, armed forces, immigration, the judicial system, entertainment and sports, countries are making far-reaching decisions regarding when to strive for diversity and when to stress meritocracy.

Some may consider the goals of diversity and meritocracy to be noncontradictory. In practice, however, the two goals are often difficult to reconcile, especially with imprecise definitions, differing concepts and lack of reliable measures.

Promoting diversity certainly poses a variety of challenges for societies. However, the pursuit of meritocracy also faces unrecognized risks and biases as well as discrimination behind efforts to reward merit.

The rewards ascribed to meritocracy are often simply the result of privilege, legacy and entitlement. In addition, some have argued that the pursuit of meritocracy actually produces inequality, stifles social mobility and increases unhappiness.

Admittedly, diversity and meritocracy across country populations are varied and differ considerably globally. Nevertheless, useful insight may be gained from considering the experience of a country that exemplifies a nation attempting to find the appropriate balance between diversity and meritocracy: the United States.

U.S laws prohibit discrimination on the basis of race. At the same, however, policies and practices, such as affirmative action, aim at countering discrimination against certain racial groups by increasing their chances for employment, promotion, higher education and other opportunities.

Since the first U.S. census in 1790, the U.S. Census Bureau has been tasked to gather information on the racial composition of America’s population. In the 1790 census an estimated 81 percent of the U.S. population was identified as white with the remaining 19 percent enumerated as black, with 92 percent of them being slaves.

The white proportion of the U.S. population rose to 90 percent in 1920, where it remained until 1950 when it began declining and reached 80 percent in 1990. At the start of the 21st century the proportion white declined further to approximately 75 percent where it has remained. The proportion white is projected to continue declining, reaching 68 percent of the U.S. population by 2060 (Figure 1).

The methods employed by the Census Bureau to collect race data over the past 230 years have evolved, reflecting changes in American society. Based on the 1997 Office of Management and Budget (OMB) standards on race, the Census Bureau gathers self-identified responses to the race question, with respondents permitted to select more than one race.

OMB requires five minimum categories: White, Black or African American, Asian, American Indian or Alaska Native, and Native Hawaiian or Other Pacific Islander. Those categories reflect a social definition of race and do not define race biologically, anthropologically, or genetically.

The race categories and their proportions of America’s 2021 population of 332 million are: White at 75.8 percent, Black or African American at 13.6 percent, Asian at 6.1 percent, American Indian or Alaska Native at 1.3 percent, Native Hawaiian or Other Pacific Islander at 0.3 percent, and two or more races at 2.9 percent (Figure 2).

Reviewing a number of examples from different areas of life in the United States is useful in illustrating the various aspects of the country’s efforts to balance racial diversity and meritocracy.

In professional basketball African Americans represented 20 percent of league players in 1960. Today African Americans account for approximately 75 percent of basketball players in the National Basketball Association.

Among the country’s orchestras, in contrast, African Americans account for less than 2 percent of the players. Nearly a half century ago, the selection of musicians for orchestras was changed to blind auditions in which candidates performed behind a curtain. As blind auditions have not led to making orchestras more diverse, some have called for ending blind auditions and taking race into account so orchestras reflect the communities they serve.

In professional football African Americans represent 58 percent of the players. However, they account for 9 percent of the head coaches, or five head coaches in the 32-team league of the National Football League (NFL).

Nearly 20 years ago after accusations of discriminatory head coach hiring practices, the NFL team owners agreed to policy changes to address those accusations. Among those changes was the so-called Rooney Rule, which said, “Any club seeking to hire a head coach will interview one or more minority applicants for that position.”

In the armed services, African Americans make up 23 percent of enlisted soldiers, which is approaching nearly double their proportion of the U.S. population. Among officers, however, the percentage of African Americans is considerably lower at 11 percent.

The U.S. military has taken a number of initiatives to promote racial diversity at the higher ranks. The Army, for example, has removed photos of officers from personnel files so promotion boards are less aware of race and they have more minority officers choosing combat assignments, which is a critical stepping stone to high-star officer ranks.

With respect to higher education, the racially conscious admissions practices of Harvard University and the University of North Carolina are being challenged in cases currently before the Supreme Court. The court is being asked to consider the constitutionality of racial preference in college admissions of those two universities.

Asian Americans admissions to Harvard University and the University of North Carolina are 25 and 22 percent, respectively. Those percentages are approximately four times the proportion of Asian Americans in the U.S. population.

Nevertheless, the racially conscious admissions practices of those two universities are being considered by the court. After its initial hearing of the cases on 31 October, the Supreme Court appeared ready based on its questioning and comments to rule that the admissions programs of Harvard and the University of North Carolina were unlawful.

Those admission practices, which allegedly discriminate against Asian Americans and effectively cap Asian matriculation numbers, have drawn comparison to the past efforts by Harvard and other elite universities to limit the enrollment of Jewish Americans. If only academics were considered, internal research by Harvard University suggests that Asian Americans would make up 43 percent of an admitted class.

In four Gallup polls from 2003to 2016, at least two-thirds of Americans saidcollege admissions should be solely on the basis of merit. A more recent national Washington Post survey in October found a majority of Americans, 63 percent, supported a ban on the consideration of race in college admissions. At the same time, however, a majority in that survey, 64 percent, endorsed programs to boost racial diversity on campuses.

Imbalances in achieving racial diversity are also reflected in the composition of America’s professions. For example, while Asian Americans represent 17 percent of active physicians, the proportion for African Americans is 5 percent.

Similarly in science and engineering occupations, the proportions for Asian Americans and African Americans are 21 and 5 percent, respectively. Among U.S. lawyers, the proportions are relatively low for both Asian Americans and African Americans at 2 and 5 percent, respectively.

The personal views of Americans concerning workplace diversity also reflect the difficulties in balancing racial diversity and meritocracy. One national PEW survey in 2019 found that a majority, 75 percent, value workplace diversity. However, a majority in that survey, 74 percent, also felt that only the qualifications and not an applicant’s race should be taken into account in hiring and promotions even if it results in less diversity.

The issue of how best to balance diversity and meritocracy remains a major challenge for America as well as for many other countries. That challenge has become more difficult in the United States. with the puzzling and prejudicial use of racial, ethnic, linguistic, ancestry and origin categories that increasingly make little sense.

In sum, with a growing world population of eight billion, the shifting demographic landscapes of national populations and the fundamental need to ensure human rights for all, the challenge of how to balance diversity and meritocracy can be expected to become even more critical and consequential for countries in the years ahead.

Joseph Chamie is a consulting demographer, a former director of the United Nations Population Division and author of numerous publications on population issues, including his recent book, “Births, Deaths, Migrations and Other Important Population Matters.”

© Inter Press Service (2022) — All Rights ReservedOriginal source: Inter Press Service

Check out our Latest News and Follow us at Facebook

Original Source

World Population after 8,000,000,000 — Global Issues

Source: United Nations.
  • Opinion by Joseph Chamie (portland, usa)
  • Inter Press Service

Moreover, that fancied collapse of world population is neither the biggest problem facing the world nor is that false notion a much bigger risk to civilization than climate change, which is certainly humanity’s greatest challenge.

According to recent projections, the world’s population is expected to continue increasing over the coming decades. Hundreds of millions of more people are projected to be added to the planet, but at a slower pace than during the recent past.

The expected slowdown in the growth of world population does not constitute a problem. The global demographic slowdown clearly signals social, economic, environmental and climatic successes and benefits for human life on planet Earth.

Many of those calling for increased rates of population growth through higher birth rates and more immigration are simply promoting Ponzi demography. The underlying strategy of Ponzi demography is to privatize the profits and socialize the costs incurred from increased population growth.

World population reached the 1 billion milestone in 1804. World population doubled to 2 billion in 1927, doubled again to 4 billion in 1974, and then doubled a third time to 8 billion in 2022 (Figure 1).

Throughout the many centuries of human history, the 20th century was an exceptional record-breaking period demographically.

World population nearly quadrupled from 1.6 billion in 1900 to 6.1 billion by the close of the century. In addition, the world’s population annual growth rate peaked at 2.3 percent in 1963 and the annual increase reached a record high of 93 million in 1990.

Since the start of the 21st century, the world’s population has increased by nearly 2 billion people, from 6.1 billion in 2000 to 8 billion in 2022. Over that time period, the world’s annual rate of population growth declined from 1.3 percent to 0.8 percent, with the world’s annual demographic increase going from 82 million to 67 million today.

While mortality continues to play an important role in the growth of the world’s population, as witnessed recently with the COVID-19 pandemic, fertility is expected to be the major determinant of the future size of world population.

The world’s average fertility rate of approximately 2.3 births per woman in 2020 is less than half the average fertility rates during the 1950s and 1960s.

The United Nations medium variant population projection assumes fertility rates will continue to decline. By the century’s close the total fertility rate is expected to decline to a global average of 1.8 births per woman, which is one-third the rate of the early 1960s and well below the fertility replacement level.

The medium variant projection results in an increasing world population that reaches 9 billion by 2037, 10 billion by 2058 and 10.3 billion by 2100.

Alternative population projections include the high and low variants, which assume approximately a half child above and below the medium variant, respectively. Accordingly, world population by 2100 ends up being substantially larger in the high variant at 14.8 billion and substantially smaller in the low variant at 7.0 billion (Figure 2).

Another alternative population projection, which is unlikely but instructive, is the constant variant. That projection variant assumes the current fertility rates of countries remain unchanged or constant at their current levels throughout the remainder of the 21st century. The constant variant results in a projected world population at the close of the century that is more than double its current size, 19.2 versus 8.0 billion.

Although world population is projected to continue increasing over the coming decades, considerable diversity exists in the future population growth of countries.

The populations of some 50 countries, including China, Germany, Italy, Japan, Russia, South Korea and Spain, are expected to decline in size by midcentury due to low fertility rates. At the same time, the populations of about two dozen other countries, including Afghanistan, Democratic Republic of the Congo, Nigeria, Niger, Somalia and Sudan, are expected to increase substantially due to their comparatively high fertility rates.

A comparison of the growth of the populations according to the medium variant for the four projected largest countries by midcentury, i.e., China, India, Nigeria, and the United States, highlights the diversity of population growth expected during the 21st century.

China’s current population size is estimated to be near its peak at approximately 1.4 billion. Due to its fertility rate of 1.16 births per woman, which is close to half the replacement level and is assumed to remain relatively low over the coming decades, the Chinese population is expected to decline to 1.3 billion by 2050 and decline further to 0.8 billion by 2100.

In contrast, India’s population, which has an estimated fertility rate of 2.0 births per woman that is expected to decline further, is continuing to increase in size. As a result of that demographic growth, India’s population will likely overtake China’s population by 2023. By 2060 India’s population is projected to peak at 1.7 billion and decline to 1.5 billion by 2100 (Figure 3).

The population of the United States, currently the third world’s largest population after China and India, is expected to continue increasing in size largely due to immigration. By 2050 the U.S. population is projected to reach 375 million and be close to 400 million by the century’s close.

Nigeria’s rapidly growing population, which more than doubled over the past 30 years from 100 million in 1992 to 219 million in 2022, is expected to continue its rapid demographic growth for the remainder of the century. The population of Nigeria is expected to be larger than the U.S. population by 2050, when it reaches 377 million, and then increase to 500 mil1ion in 2077 and 546 million by the century’s close.

Admittedly, the future size of the world’s population remains uncertain. Demographic conditions, especially mortality levels as recently witnessed with the COVID-19 pandemic, could change markedly and future fertility rates may also follow different patterns from those being assumed in the most recent population projections.

Nevertheless, it appears that the world’s current population of 8 billion will continue increasing over the coming decades, likely gaining an additional 2 billion people by around midcentury.

The expected demographic growth of the world’s population of 8 billion during the 21st century poses daunting challenges. Prominent among those challenges are dire concerns about food, water and energy supplies, natural resources, biodiversity, pollution, the environment, and of course climate change, considered by most, including the world’s scientists, to be humanity’s greatest challenge.

Joseph Chamie is an independent consulting demographer, a former director of the United Nations Population Division and author of numerous publications on population issues, including his recent book, “Births, Deaths, Migrations and Other Important Population Matters.”

© Inter Press Service (2022) — All Rights ReservedOriginal source: Inter Press Service

Check out our Latest News and Follow us at Facebook

Original Source

U.S. Political Divides on Demographic Issues — Global Issues

Republicans in general favor less immigration than Democrats. For example, a national Gallup poll in July 2022 found that the proportion saying immigration to America should be decreased was 69 percent among Republicans versus 17 percent among Democrats. Credit: Guillermo Arias / IPS
  • Opinion by Joseph Chamie (portland, usa)
  • Inter Press Service

On virtually every major demographic issue, including reproduction, mortality, immigration, ethnic composition, gender, marriage and population ageing, significant divides exist between the Democrats and Republicans (Figure 1). Those divides have significant consequences and implications for current and future government policies and programs.

Those divides on vital demographic matters, which have become increasingly politicized by the two major parties, are reinforcing political polarization and partisan antipathy across the country and hindering the economic, social and cultural development of the United States.

With respect to reproduction, while most Democrats are in favor of a woman’s legal access to abortion, most Republicans are not. For example, a March 2022 PEW national survey found that proportion of Democrats saying abortion should be legal in all or most cases was more than twice that of Republicans, i.e., 80 versus 38 percent.

Also, Gallup polls indicate a widening gap since the late 1980s between Democrats and Republicans on the circumstances permitting abortion. By 2022, for example, the proportions of Democrats and Republicans saying abortions should be legal under any circumstances were 57 and 10 percent, respectively (Figure 2).

A similar difference on abortion is evident among members of Congress and justices of the Supreme Court. While Congressional Democrats are largely in favor codifying access to abortion and safeguards to the right to travel across state lines to undergo the procedure, Congressional Republicans are opposed to such access and safeguards. And the recent Supreme Court abortion decision ending the right to abortion reflects the divides in the views of justices appointed by Republican and Democrat administrations.

Concerning access to birth control methods, the vote on the recently passed bill by the House of Representatives was mostly along party lines. All but eight Republicans opposed the bill that aims to ensure access to contraception. In the Senate, the birth control measure is expected to fail as most Republicans are likely to be against it.

On mortality and morbidity issues, Congressional Democratic and Republican leaders are also divided. A notable example of that divide has been the sustained Republican opposition to the Affordable Care Act enacted by Democrats more than a decade ago.

Recent research has also found that more premature deaths occur in Republican-leaning counties than in Democratic-leaning counties. The policies adopted by Democratic-leaning states compared to those in Republican states are believed to have contributed to the greater divide in mortality outcomes. Those policies include Medicaid expansion, health care access, minimum wage legislation, tobacco control, gun legislation, and drug addiction treatment.

The early responses to the COVID-19 pandemic, which was transformed from a public health concern into a major political issue, also reflect the divide in mortality outcomes between Democrats and Republicans. While mask wearing, social distancing, and related preventive measures were often stressed by most Democratic officials, many Republican leaders resisted such measures and downplayed the risks of the coronavirus.

Those partisan differences concerning the COVID-19 pandemic were reflected in the behavior and attitudes of Republicans and Democrats across the country. As a result of those attitudinal and behavioral differences, Republican-leaning counties have had higher COVID-19 death rates than Democrat-leaning counties.

With respect to immigration, Republicans in general favor less immigration than Democrats. For example, a national Gallup poll in July 2022 found that the proportion saying immigration to America should be decreased was 69 percent among Republicans versus 17 percent among Democrats. The rise for decreased immigration during the past several years is primarily due to Republicans, whose desire for reducing immigration increased by 21 points since June 2020 compared to an increase of 4 points among Democrats (Figure 3).

To address immigration levels, the former Republican administration advocated building a wall along the U.S.-Mexico border and limiting the granting of asylum claims. In contrast, most Democratic leaders have not been in favor of erecting a border wall. Also, the current Democratic administration has been removing obstacles to granting asylum claims, including ending the former administration’s “Remain in Mexico” policy.

Concerning the more than 11 million illegal immigrants residing in the country, the former Republican administration wanted to ban counting them in the 2020 census. The desired exclusion of undocumented migrants in the census enumeration was aimed at not including them when determining Congressional representation. The current Democratic administration, in contrast, includes undocumented migrants in the census count and determining Congressional representation.

On whether to offer an amnesty to immigrants living unlawfully in the country, a wide divide exists between the two major political parties. While Democrats are largely in favor of offering illegal immigrants a path to U.S. citizenship, many Republicans oppose granting an amnesty to those who are unlawfully resident in the country. A PEW survey in August 2022, for example, found the proportion in favor of a path to U.S. citizenship among Democrats was more than double the level among the Republicans, 80 versus 37 percent, respectively.

Regarding the changing ethnic composition of the U.S. population, Democrats tend to view the changes more favorably than Republicans. For example, one national PEW survey found Democrats three times more likely than Republicans to say a majority nonwhite population will strengthen America’s customs and values, i.e., 42 and 13 percent, respectively.

Similar divides between Democrats and Republicans were found with respect to interracial marriage and same-sex marriage. The growth of interracial marriage is considered to be a good thing for the country by a majority of Democrats and a minority of Republicans, 61 and 33 percent, respectively. Also, Democrats have been consistently more likely than Republicans to say that same-sex marriages should recognized by the law as valid, with the proportions in 2022 at 83 and 55 percent, respectively (Figure 4).

Democrats and Republicans also differ in their views about gender identity. While a national PEW survey found 80 percent of Republicans saying that whether someone is a man or a woman is determined by the sex assigned at birth, 64 percent of Democrats took the opposite view, believing that a person’s gender can be different from the sex assigned at birth.

Moreover, the majority of Republicans, 57 percent, say that society has gone too far in accepting people who are transgender, compared to 12 percent of Democrats.

On the issue of population ageing, noteworthy policy differences with program implications exist between Democrats and Republicans. In general, Republican leaders have resisted government entitlement programs established by Democrats, such as Social Security and Medicare, preferring reliance on the private sector, freedom of choice and individual responsibility.

Republican leaders have proposed replacing those major programs for older Americans with private investment accounts and a voucher system for health insurance. In addition, some Republicans recommend eliminating Social Security and Medicare as federal entitlement programs and have them become programs approved by Congress annually as discretionary spending.

A similar political divide exists among Americans concerning the provision of long-term care that the elderly may need. One national PEW survey in 2019 reported that while two-thirds of Democrats say the government should be mostly responsible for paying for that care for the elderly, 40 percent of Republicans have that view.

In sum, significant divides currently exist between Democrats and Republicans on nearly every major demographic issue facing the United States. Those divides are being politicized by the two parties, reinforcing political polarization and partisan antipathy across the country, which in turn are affecting domestic legislation and foreign policy as well as hampering America’s progress in the 21st century.

Joseph Chamie is a consulting demographer, a former director of the United Nations Population Division and author of numerous publications on population issues, including his recent book, “Births, Deaths, Migrations and Other Important Population Matters.”

© Inter Press Service (2022) — All Rights ReservedOriginal source: Inter Press Service

Check out our Latest News and Follow us at Facebook

Original Source

Demography of the Israeli-Palestinian Conflict — Global Issues

The current Israeli prime minister, Yair Lapid, speaking at the opening of the 77th session of the United Nations General Assembly, expressed his government’s backing for a two-state solution with the Palestinians. Credit: UN Photo/Cia Pak
  • Opinion by Joseph Chamie (portland, usa)
  • Inter Press Service

An Israeli-Palestinian peace can’t wait another year, another decade, or another 75 years. Too many Israelis and Palestinians are being killed, too many are being repressed, and too many are longing for peace.

The movement for a national homeland for Jews in Palestine, which prior to World War I was part of Ottoman Syria, began in earnest in the late 19th century amidst growing European anti-Semitism and the Zionist movement to establish a Jewish nation in Zion. The movement secured support among Western European governments, especially with the 1917 British Balfour Declaration supporting “the establishment in Palestine of a national home for the Jewish people.”

The tract of land in the Israeli-Palestinian conflict, established as the British Mandate of Palestine in 1922, is relatively small, about half the size of Denmark, and had a population of about three-quarters of a million. A century later, the population in that tract of land has increased nearly twentyfold to 14.8 million, with 9.6 million in Israel and 5.3 million in the State of Palestine.

Jewish migration to the British Mandate of Palestine increased during the first half of the 20th century. As a result of that migration, the religious composition of the resident population underwent noteworthy change. The estimated numbers of Jewish migrants during the 1920s, 1930s, and 1940 to 1945 are 100,000, 223,000, and 45,000, respectively, resulting in a total of 368,000 (Figure 1).

The resident Palestinian population in the British Mandate of Palestine was predominantly Muslims and Christians. Their proportion was close to 90 percent in 1922. By 1931 the proportion declined to 83 percent and to 68 percent by the mid 1940s. In 1945 the estimated proportions of Muslims, Jews, and Christians of the population in British Mandate of Palestine were 60, 31, and 8 percent, respectively (Table 1).

With the establishment of Israel in 1948 in part of the former British Mandate of Palestine, the demographic compositions changed significantly with the displacement of an estimated 750,000 Palestinians. In the newly founded nation of Israel with a population close to one million the estimated proportion Jewish was 82 percent, which rose to a record high of 89 percent a decade later.

The demographic changes in the natural increase, migration and religious composition of the populations residing in the former British Mandate of Palestine continued throughout the second half of the 20th century as well as into the first two decades of the 21st century.

Moving to today, the current Israeli prime minister, Yair Lapid, speaking at the opening of the 77th session of the United Nations General Assembly, expressed his government’s backing for a two-state solution with the Palestinians.

The Israeli prime minister said, “An agreement with the Palestinians, based on two states for two peoples, is the right thing for Israel’s security, for Israel’s economy and for the future of our children.” He added that despite the obstacles, a large majority of Israelis support the two-state solution.

In his statement to the General Assembly, the Palestinian president, Mahmoud Abbas, took note of the Israeli prime minister’s call for a two-state solution. He added that Palestine also looks forward to achieving peace with Israel.

The Palestinian president said, “Let us make this peace to live in security, stability and prosperity for the benefit of our generations and all the people of the region.”

Also, in his remarks to the General Assembly, the U.S. president, Joseph Biden, called for a lasting peace between Israelis and Palestinians.

The American president said, “And a negotiated two-state solution remains, in our view, the best way to ensure Israel’s security and prosperity for the future and give the Palestinians the state which — to which they are entitled — both sides to fully respect the equal rights of their citizens; both people enjoying equal measure of freedom and dignity.”

At the time of the General Assembly, the Arab Peace Committee also promoted its two-decade old proposal calling for peace and normalization for Arab countries with Israel in return for a complete Israeli withdrawal from Palestinian land captured during the 1967 war and for the creation of a Palestinian state. That proposal is consistent with UN Security Council Resolution 242, which called for Israel to withdraw from occupied lands to secure and recognize borders in exchange for peace.

Various options have been proposed to address the nearly century long conflict. Those options include a confederation of Israel, Jordan and Palestine, autonomy-plus for the Palestinians, a federation of smaller Palestinian provinces or cantons, and the expulsion or transfer of the Palestinians from the West Bank, also referred to as Judea and Samaria by Israel (Table 2)

Besides the long and widely advocated two-state solution, two major choices now facing the Israelis and Palestinians are the continuation of the status quo and the one-state solution. However, many consider the continuation of the status quo to be untenable, clearly not a resolution to the conflict, and also places Israel’s democracy in peril.

In addition, Israeli, Palestinian and international human rights organizations as well as independent observers have found Israel practicing apartheid in the occupied Palestinian territory.

Amnesty International, for example, reported Israel enforcing a system of oppression and domination against the Palestinians wherever it has control over their rights. Similar findings were reported by Human Rights Watch, the UN Special Rapporteur, the Israeli human rights group B’Tselem, and the Palestinian human rights group Al-Haq. In addition, one quarter of American Jews now say Israel is an apartheid state.

Israel, however, rejects the accusation that it is practicing apartheid, saying “it is a democracy committed to international law and open to scrutiny”. Its government cites security concerns in imposing travel restrictions on Palestinians, whose uprising in past decades included suicide bombings in Israeli cities.

Some fundamental Israeli and Palestinian demographics provide some relevant insight into the likely religious composition in the one-state solution.

At the eve of the Jewish New Year 5782 observed on 25 September Israel’s population stood at 9.6 million residents, with 7.1 million, or 73.7 percent, being Jewish. The State of Palestine’s population is estimated at slightly more than half the size of Israel’s, at approximately 5.3 million.

Combining the Israeli and Palestinian populations yields an overall total population in 2022 of 14.8 million. The Jewish proportion of that combined population turns out to be a minority of 48 percent. Moreover, the Jewish proportion of the population in the one-state solution is projected to decline to 46 percent by 2030 and further to 45 percent by 2048 (Figure 2).

Regarding the prospects of the two-state solution, while some stress that it is desirable and achievable, others believe that it is no longer an option primarily due to today’s realities. Nearly 700,000 Israelis are currently living in settlements in East Jerusalem and the West Bank.

In addition, many of Israel’s political leaders, even those of the center-left, do not support a viable, sovereign Palestinian state. Also, the former prime minister, Benjamin Netanyahu, has pledged to impose Israeli sovereignty in parts of the West Bank. In practical terms, some have concluded that Israel annexed the West Bank long ago.

Achieving a just and comprehensive two-state solution to the Israeli-Palestinian conflict is a formidable undertaking, with many serious challenges. Prominent among those challenges are the status of Jerusalem, the million plus Palestinian refugees in neighboring countries, religious extremists, international boundaries and security.

Given the facts on the ground and political realities, some have concluded that it’s time to abandon the traditional two-state solution and embrace equal rights for Israelis and Palestinians in a single state. The one-state solution, however, would clearly be at odds with Israel remaining a “Jewish and democratic state”.

Despite the weighty obstacles, a negotiated peace would lead to innumerable benefits. The Israelis and Palestinians could reap the rewards of peace, reconciliation, and prospects for a better future. In addition, peace would strengthen and expand relationships with countries in this strategically important region.

In brief, the time for Israelis and Palestinians to negotiate “שָׁלוֹם“ ,“سلام”, or “peace” solution is now.

Joseph Chamie is an independent consulting demographer, a former director of the United Nations Population Division and author of numerous publications on population issues, including his recent book, “Births, Deaths, Migrations and Other Important Population Matters.”

© Inter Press Service (2022) — All Rights ReservedOriginal source: Inter Press Service

Check out our Latest News and Follow us at Facebook

Original Source

Population Growth Diversity Continuing in the 21st Century — Global Issues

Source: United Nations.
  • Opinion by Joseph Chamie (portland, usa)
  • Inter Press Service

At one extreme are some 50 countries, accounting for close to 30 percent of today’s world population, whose populations are expected to decline over the coming decades.

By 2060, for example, those projected population declines include 9 percent in Germany, 11 percent in Russia, 13 percent in Spain, 15 percent in China, 17 percent in Poland, 18 percent in Italy, 21 percent in South Korea, 22 percent in Japan, and 31 percent in Bulgaria (Figure 1).

In terms of the size of those population declines, the largest is in China with a projected decline of 218 million by 2060. Following China are population declines in Japan and Russia of 27 million and 16 million, respectively.

At the other extreme, the population of 25 countries, accounting for nearly 10 percent of the world’s population, are expected to more than double by 2060. Those projected population increases by 2060 include 106 percent in Afghanistan, 109 percent in Sudan, 113 percent in Uganda, 136 percent in Tanzania, 142 percent in Angola, 147 percent in Somalia, 167 percent in the Democratic Republic of the Congo, and 227 percent in Niger (Figure 2).

With respect to the size of the populations that are projected to more than double, the largest is in the Democratic Republic of the Congo (DRC) with a projected increase of 165 million by 2060. DRC is followed by population increases in Tanzania and Niger of 89 million and 60 million, respectively.

In between the extremes of declining and doubling populations are 120 intermediate growth countries. They account for about 60 percent of today’s world population and are projected to have larger populations by 2060 to varying degrees.

Those projected increases in population size include 13 percent in the United States, 17 percent New Zealand, 20 percent in India, 24 percent in Canada, 29 percent in Australia, 38 percent Saudi Arabia, 58 percent Israel, 95 percent in Nigeria, and 98 percent in Ethiopia (Figure 3).

Among the intermediate growth countries, the largest expected population growth is in India with a projected increase of 278 million by 2060. India is followed by Nigeria and Ethiopia with population increases of 208 million and 121 million, respectively.

The continuing significant differences in the rates demographic growth are resulting in a noteworthy reordering of countries by population size.

For example, while in 1980 about half of the 15 largest country populations were developed countries, by 2020 that number declined to one country, the United States. Also, Nigeria, which was eleventh largest population in 1980, was the seventh largest in 2020 and is projected to be the third largest population in 2060 with the United States moving to fourth place (Table 1).

In addition, China, the world’s most populous country is expected to be overtaken by India in 2023. Moreover, by 2060 India’s population is projected to be nearly a half billion more than China’s, 1.7 billion versus 1.2 billion, respectively.

The major explanation behind the diversity in population growth rates is differing fertility levels. While the countries whose populations are projected to at least double by 2060 have fertility rates of four to six births per woman, those whose populations are projected to decline have fertility rates below two births per woman.

About two-thirds of the world’s population of 8 billion live in a country, including the three most populous China, India and the United States, where the fertility rate has fallen below the replacement level of 2.1 births per woman. In addition, most of those populations have experienced low fertility rates for decades.

Also, many countries are experiencing fertility rates that are approximately half the replacement level or less. For example, the total fertility rate declined to 1.2 births per woman for China and Italy, 1.3 for Japan and Spain, with South Korea reaching a record low of 0.8 births per woman.

The population of some countries with below replacement fertility, such as Australia, Canada, New Zealand, and the United States, are projected to continue growing due to international migration. However, if international migration to those countries stopped, their populations would begin declining in a few decades just like other countries with below replacement fertility levels.

In hopes of avoiding population decline, many countries are seeking to raise their fertility rates back to at least the replacement level. Among the countries with below replacement fertility close to two-thirds have adopted policies to increase their rates, including baby bonuses, family allowances, parental leave, tax incentives, and flexible work schedules.

Most recently, China announced new measures to raise its below replacement fertility rate by making it easier to work and raise a family. Those measures include flexible working arrangements and preferential housing policies for families, as well as support on education, employment, and taxes to encourage childbearing.

Despite the desires, policies, and programs of governments to raise fertility levels, returning to replacement level fertility is not envisaged for the foreseeable future.

The world’s average total fertility rate of 2.4 births per woman in 2020, which is about half the levels during the 1950s and 1960s, is projected to decline to the replacement level by midcentury and to 1.8 births per woman by the end of the 21st century. Consequently, by 2050 some 50 countries are expected to have smaller populations than today, and that number is projected to rise to 72 countries by 2100.

As many of those countries are in Europe, that continent’s current population of 744 million is expected to decline to 703 million by midcentury. By the century’s close Europe’s population is projected to be a fifth smaller than it is today, i.e., from 744 million to 585 million.

In contrast, the populations of roughly three dozen countries with current fertility levels of more than four births per woman are expected to continue growing throughout the century.

As most of those countries are in Africa, that continent’s population is projected to double by around midcentury. Moreover, by close of the 21st century Africa’s population is projected to be triple its current size, i.e., from 1.3 billion to 3.9 billion.

In sum, considerable diversity in the growth of populations is expected to continue throughout the 21st century. While the populations of many countries are projected to decline, the populations of many others are projected to increase. The net result of that diversity is the world’s current population of 8 billion is expected to increase to 10 billion around midcentury.

Joseph Chamie is a consulting demographer, a former director of the United Nations Population Division and author of numerous publications on population issues, including his recent book, “Births, Deaths, Migrations and Other Important Population Matters.”

© Inter Press Service (2022) — All Rights ReservedOriginal source: Inter Press Service

Check out our Latest News and Follow us at Facebook

Original Source

Climate Change Crisis Nonacceptance — Global Issues

The nonacceptance of the climate change crisis persists despite its increasingly visible worldwide consequences. Credit: Manipadma Jena/IPS
  • Opinion by Joseph Chamie (portland, usa)
  • Inter Press Service

The unequivocal findings of numerous reports on the consequences of climate change by international and national scientific committees have not been sufficient to counter climate change skepticism. On the contrary, the reactions of skeptics to the climate change reports can be summed up in the phrase “Don’t confuse me with the facts”.

The rise of right-wing populism in many countries also constitutes a potential obstacle to addressing climate change. Right-wing parties and politicians frequently voice climate change skepticism, denials, and opposition to climate change policies, such as carbon taxes.

The nonacceptance of the climate change crisis persists despite its increasingly visible worldwide consequences. It’s indeed difficult to avoid news reports of climate change events, including extreme heat, flooding, droughts, destroyed crops, wildfires, melting glaciers, rising sea levels, biodiversity loss, environmental degradation, smog, pollution, and increasing rates of human morbidity and mortality.

Even the signed petitions to government leaders from thousands of scientists from around the world warning of a climate emergency and the concerns, demonstrations, and protests of younger generations calling for urgent action have not been enough to convince skeptics of the climate change threat, especially among the political right.

In general, the majorities of most populations are concerned about the climate change crisis. A global survey by the United Nations Development Programme (UNDP) of public opinion in 2021 covering 50 countries and over half of the world’s population found that nearly two-thirds of those surveyed believed climate change is a global emergency.

The proportion of the population believing climate change is an emergency ranged from a low of 61 percent in sub-Saharan Africa to a high of 71 percent in Western Europe and North America. The proportions of the remaining four regions varied from 63 to 65 percent (Figure 1).

In addition to the UNDP study, a 2022 PEW survey of nineteen countries across North America, Europe, and the Asia-Pacific region found a median of 75 percent viewing global climate change as a major threat to their country.

However, views concerning the climate change threat differed considerably across political groups. By and large, surveys find that those of the political right are less likely than those of the left to believe in the reality and anthropogenic nature of the climate change crisis.

In the 2022 PEW survey, for example, those on the political right in fourteen countries were found to be consistently less likely to consider climate change a major threat to their country than those on the political left (Figure 2).

The largest difference among those fourteen countries was in the United States where 22 percent of the political right considered climate change a major threat to their country versus 85 percent on the political left. Other countries with a large difference between those on the political right and left were Australia with 47 and 91 percent, Canada with 46 and 80 percent, and Germany with 59 and 83 percent, respectively.

Moreover, the differences in the views of political groups concerning climate change in some major countries have widened over the recent past. In the United States, for example, the difference between Republicans and Democrats has increased substantially over the past quarter century.

Near the start of the 21st century 20 percent of Republicans and 36 percent of Democrats believed that global warming will pose a serious threat in their lifetime. By 2021, the difference between Republicans and Democrats had widened substantially to 11 percent versus 67 percent, respectively (Figure 3).

Also, differing views about climate change are reflected in the statements and policies of political parties and their leaders. For example, the Vox party in Spain dismissed climate change as “a hoax”, the National Front in France promoted climate skepticism, and Sweden’s Democrats described the climate debate as “weird” in budget discussions, arguing that the seriousness of climate change is exaggerated, and scientific evidence is being distorted.

In Germany the far-right Alternative für Deutschland (AfD) challenged the global scientific consensus on climate change, describing it as “hysteria”. In addition, the AfD abandoned the previous cross-party consensus on the findings of the Intergovernmental Panel on Climate Change (IPCC)

In the United States, the world’s second largest emitter of CO2 producing about 14 percent of the world’s CO2 emissions, the former Republican president said that he was not a believer in man-made global warming, called climate change “a hoax” invented by China, and said scientists were “misleading us” on climate change. Moreover, he dismissed federal scientific reports on climate change and sought to roll back climate regulations, including increasing U.S. coal mining and reconsidering fuel efficiency standards for vehicles.

In China, the world’s top emitter of CO2 producing about 30 percent of the world’s CO2 emissions, some report that the Communist Party’s climate change skeptics are mostly shunned and may chatter in the shadows. After decades of rejecting climate change and its visible consequences, such as choking smog hanging over most of the country, no higher-up Chinese officials are saying that climate change is a hoax and while some may have that view, they won’t say it.

In India, which the IPCC highlights as a vulnerable hotspot, some find politicians denying or ignoring climate change. They note that in the election manifestos of the two leading national parties, the Indian National Congress and the BJP, neither of them mentioned the Paris Climate Change Agreement. Also at the COP26 climate summit in Glasgow, India reportedly found the IPCC’s recent report too gloomy and requested a section on mitigation be removed.

A preliminary draft of the Glasgow pact called on countries to “accelerate the phasing out of coal and subsidies for fossil fuels”. In the final negotiations, however, India and China, whose coal-fired power stations provide approximately 70 and 60 percent of their electricity, respectively, said they would agree only to “phase-down unabated coal” and the phase-out of inefficient fossil fuel subsidies.

In addition, when heading to COP26, Australia, Japan, and Saudi Arabia were among those countries lobbying the United Nations “to play down the need to move rapidly away from fossil fuels”. Some wealthy nations also questioned paying more to poorer states to move to greener technologies.

In preparatory meetings for the November COP27 climate summit in Sharm El-Sheikh, Egypt, African nations pushed back against abrupt moves away from fossil fuels. They stressed the need to avoid approaches that encourage abrupt disinvestments from fossil fuels, which would threaten Africa’s development. For example, Nigeria, Africa’s largest population, indicated that gas was a matter of survival for the country.

The latest report of the International Panel on Climate Change (IPCC) shows greenhouse gas emissions are continuing to rise. The IPCC report also states that current plans to address climate change are not ambitious enough to limit warming to 1.5 degrees Celsius above pre-industrial levels, which is a threshold necessary to avoid even more catastrophic impacts.

A number of social and psychological explanations have been offered for climate change crisis nonacceptance and skepticism, especially among the right-wing conservatives. In the past, the lack of knowledge about the causes of climate change was believed to play a major role. More recently, political ideology and party identification are believed to strongly influence how people selectively seek and interpret information about climate change.

Political beliefs and motivations have also been found to guide people’s attention, perceptions, and understanding of climate change evidence and mitigation efforts. In addition, some are not willing to accept the climate change crisis and proposed mitigation measures because they challenge their need to protect existing socioeconomic structures and traditional lifestyles, raise their anxieties about declines in living standards, and threaten development efforts, particularly in less developed countries.

In sum, it is certainly the case that the majority of most populations worldwide, especially the younger generations, are concerned about the climate change crisis. However, it is also the case that despite the overwhelming unequivocal evidence, many people, especially far-right conservatives, continue their nonacceptance of the climate change crisis.

Such a political divide with vocal opposition from the political far-right with the continuing support, political lobbying, and extensive efforts of various extractive industries is worrisome and consequential. It undermines global plans to address climate change and thwarts more ambitious efforts to limit global warming to 1.5 degrees Celsius above pre-industrial levels, the goal set in the Paris Agreement to avert the worst effects of global warming

Joseph Chamie is a consulting demographer, a former director of the United Nations Population Division and author of numerous publications on population issues, including his recent book, “Births, Deaths, Migrations and Other Important Population Matters.”

© Inter Press Service (2022) — All Rights ReservedOriginal source: Inter Press Service

Check out our Latest News and Follow us at Facebook

Original Source

The Dying Children Divide — Global Issues

Sizable differences in the levels of children dying persist especially between more developed and less developed regions. Credit: Franz Chávez/IPS
  • Opinion by Joseph Chamie (portland, usa)
  • Inter Press Service

Over the past fifty years, the death rates of infants and children under age five have declined markedly. Since 1971 the world’s infant mortality rate declined from nearly 100 deaths per 1,000 live births to 28. Similarly, the world’s under-five mortality rate declined from nearly 150 deaths per 1,000 live births to 37 (Figure 1).

Despite those impressive declines, sizable differences in the levels of children dying persist especially between more developed and less developed regions. In 2021, for example, the infant mortality rate and under-five mortality rate of the less developed regions were about eight times the levels of the more developed regions.

High rates of children dying are even more striking for many developing countries, especially in sub-Saharan Africa. While sub-Saharan Africa represented 14 percent of the world’s population in 2021, it accounted for more than 56 percent of the deaths of children under age five. In contrast, more developed regions represented 16 percent of the world’s population but accounted for 1 percent of deaths of children under age five.

In addition, the infant mortality rates of the fifteen highest countries are all located in sub-Saharan Africa. Their rates are no less than thirteen times higher than those of the more developed regions. Moreover, four of those countries, i.e., Nigeria, Sierra Leone, Central African Republic, and Somalia, have rates that are eighteen times higher than those of the more developed regions (Figure 2).

A similar pattern is clear for death rates of children under-five. The fifteen highest countries are again all in sub-Saharan Africa. They have under-five mortality rates that are at least fifteen times higher than those of the more developed regions. In addition, the rates of Somalia, Nigeria, Chad, and the Central African Republic are about twenty times higher than the levels of the more developed regions.

Important factors contributing to high levels of children dying include neonatal causes, including preterm and low birth weight, asphyxia, infection, pneumonia, malaria, diarrhea, malnutrition, HIV/AIDS, measles, and tuberculosis.

The death of mothers is also a major factor associated with high levels of children dying. High rates of maternal mortality are often the result of excessive blood loss, infection, high blood pressure, unsafe abortion, obstructed labor, anemia, malaria, and heart disease. In addition to high rates of maternal mortality, countries with high death rates of children also have high rates of women dying during their childbearing years.

For the fifteen countries with the highest rates of child mortality, for example, female mortality between age 15 and 50 is at least four times higher than the level of the more developed regions. Moreover, in the Central African Republic, Chad, Lesotho, and Nigeria, female mortality between age 15 and 50 is more than seven times the level of more developed regions (Figure 3).

One of key targets of the Sustainable Development Goal 3 (SDG 3) is by 2030 to end preventable deaths of newborns and children under five. More specifically, the goals are to reduce neonatal mortality to at least 12 deaths per 1,000 live births and under-five mortality to at least 25 deaths per 1,000 live births.

For most of the sub-Saharan countries achieving those desired goals by 2030 appears unlikely. For example, the under-five mortality rate of sub-Saharan Africa in 2021 is 72 deaths per 1,000 live births, or nearly triple the desired goal by 2030. Also, the projected 2030 under-five mortality rate for sub-Saharan Africa is 62, again more than double the desired goal of 25 deaths per 1,000 births.

The situation for the fifteen countries with the highest levels of children dying are even more striking. The under-five mortality rates of those countries are expected to remain far greater than the desired goal by 2030. For example, the 2021 under-five mortality rates for Nigeria and Somalia of about 111 deaths per 1,000 births are projected to decline to approximately 100 by 2030, or four times the goal of SDG 3.

On a variety of developmental dimensions, the countries with high rates of children dying are doing comparatively poorly. Those countries have high levels of poverty, illiteracy, and malnourishment.

Furthermore, on various global indexes, such as the Fragile State Index, the Human Development Index, the Economic Freedom Index, and the Human Freedom Index, those sub-Saharan African countries are doing comparatively poorly, typically falling in the bottom tier. For example, on the Fragile State Index, the rankings of the fifteen high child mortality countries reflect low levels of economic and social development with high levels of political instability.

Moreover, high child mortality countries are facing increasing risks of climate change. Those countries are among the least able to adapt to its consequences, such as high temperatures, droughts, flooding, and extreme weather events. Also, the same countries generally lack the financial and institutional capacities to carry out adaptation programs.

It is certainly the case that child mortality levels worldwide have declined substantially over the past half century. However, despite those impressive declines, a significant divide in the level of children dying remains between the more developed regions and most sub-Saharan African countries and other countries with high child mortality rates.

The major measures needed to address the high levels of children dying are widely recognized, with most of those deaths being due to preventable or treatable causes. According to the World Health Organization, six solutions to the most preventable causes of under-five deaths are: skilled attendants for antenatal, birth, and postnatal care; immediate and exclusive breastfeeding; access to nutrition and micronutrients; improved access to water, sanitation, and hygiene; family knowledge of danger signs in a child’s health; and immunizations.

It is also widely recognized that the financial resources, political will, social stability, and health programs that are necessary to reduce the numbers of children dying are typically lacking or seriously inadequate.

Addressing the significant divide in the rates of children dying represents a major challenge for many developing countries as well as the international community of nations that can offer aid and assistance to those countries. While the challenge is formidable, it is essential to reduce the unacceptably high levels of children dying.

Joseph Chamie is a consulting demographer, a former director of the United Nations, and his latest book is: “Births, Deaths, Migrations and Other Important Population Matters.”

© Inter Press Service (2022) — All Rights ReservedOriginal source: Inter Press Service

Check out our Latest News and Follow us at Facebook

Original Source

Exit mobile version